Methods for aligning breaks (bins) in histograms, as used in the align
argument to density_histogram().
Supports automatic partial function application with waived arguments.
Details
These functions take a sorted vector of equally-spaced breaks giving
bin edges and return a numeric offset which, if subtracted from breaks,
will align them as desired:
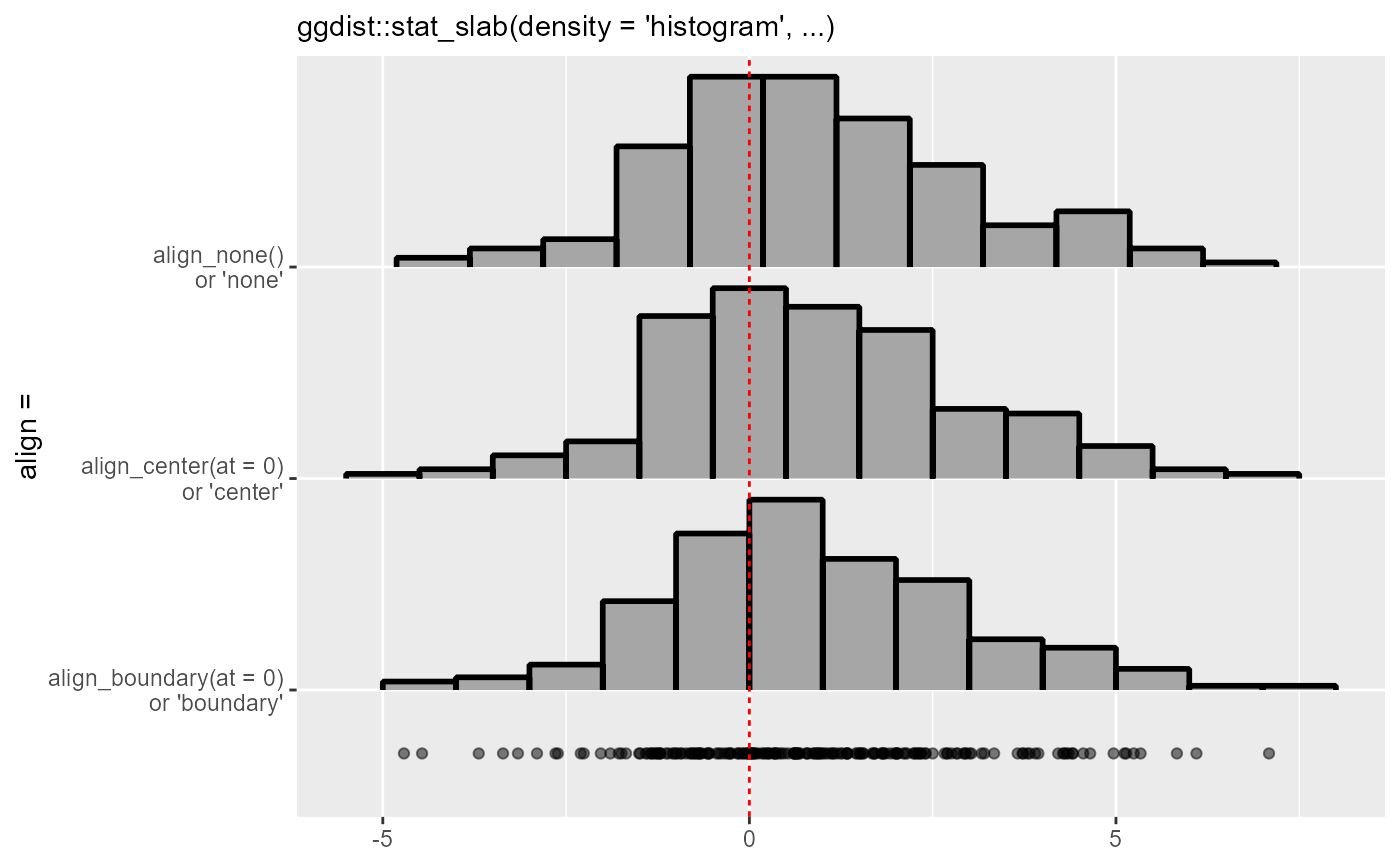
align_none()performs no alignment (it always returns0).align_boundary()ensures that a bin edge lines up withat.align_center()ensures that a bin center lines up withat.
For align_boundary() (respectively align_center()), if no bin edge (or center) in the
range of breaks would line up with at, it ensures that at is an integer
multiple of the bin width away from a bin edge (or center).
Examples
library(ggplot2)

set.seed(1234)
x = rnorm(200, 1, 2)

# If we manually specify a bin width using breaks_fixed(), the default
# alignment (align_none()) will not align bin edges to any "pretty" numbers.
# Here is a comparison of the three alignment methods on such a histogram:
ggplot(data.frame(x), aes(x)) +
  stat_slab(
    aes(y = "align_none()\nor 'none'"),
    density = "histogram",
    breaks = breaks_fixed(width = 1),
    outline_bars = TRUE,
    # no need to specify align; align_none() is the default
    color = "black",
  ) +
  stat_slab(
    aes(y = "align_center(at = 0)\nor 'center'"),
    density = "histogram",
    breaks = breaks_fixed(width = 1),
    align = align_center(at = 0),   # or align = "center"
    outline_bars = TRUE,
    color = "black",
  ) +
  stat_slab(
    aes(y = "align_boundary(at = 0)\nor 'boundary'"),
    density = "histogram",
    breaks = breaks_fixed(width = 1),
    align = align_boundary(at = 0), # or align = "boundary"
    outline_bars = TRUE,
    color = "black",
  ) +
  geom_point(aes(y = 0.7), alpha = 0.5) +
  labs(
    subtitle = "ggdist::stat_slab(density = 'histogram', ...)",
    y = "align =",
    x = NULL
  ) +
  geom_vline(xintercept = 0, linetype = "22", color = "red")