Compare the value of draws of some variable from a Bayesian model for different levels of a factor
Source:R/compare_levels.R
compare_levels.RdGiven posterior draws from a Bayesian model in long format (e.g. as
returned by spread_draws()), compare the value of a variable in those draws
across different paired combinations of levels of a factor.
compare_levels(
  data,
  variable,
  by,
  fun = `-`,
  comparison = "default",
  draw_indices = c(".chain", ".iteration", ".draw"),
  ignore_groups = ".row"
)
Arguments
- data
Long-format
data.frameof draws such as returned byspread_draws()orgather_draws(). Ifdatais a grouped data frame, comparisons will be made within groups (if one of the groups in the data frame is thebycolumn, that specific group will be ignored, as it is not possible to make comparisons both within some variable and across it simultaneously).- variable
Bare (unquoted) name of a column in data representing the variable to compare across levels. Can be a numeric variable (as in long-data-frame-of-draws format) or a
posterior::rvar.- by
Bare (unquoted) name of a column in data that is a
factororordered. The value ofvariablewill be compared across pairs of levels of thisfactor.- fun
Binary function to use for comparison. For each pair of levels of
bywe are comparing (as determined bycomparison), compute the result of this function.- comparison
One of (a) the comparison types
ordered,control,pairwise, ordefault(may also be given as strings, e.g."ordered"), see Details; (b) a user-specified function that takes afactorand returns a list of pairs of names of levels to compare (as strings) and/or unevaluated expressions containing representing the comparisons to make; or (c) a list of pairs of names of levels to compare (as strings) and/or unevaluated expressions representing the comparisons to make, e.g.:list(c("a", "b"), c("b", "c"))orexprs(a - b, b - c), both of which would compare level"a"against"b"and level"b"against"c". Note that the unevaluated expression syntax ignores thefunargument, can include any other functions desired (e.g. variable transformations), and can even include more than two levels or other columns indata. Types (b) and (c) may use named lists, in which case the provided names are used in the outputvariablecolumn instead converting the unevaluated expression to a string. You can also useemmeans_comparison()to generate a comparison function based on contrast methods from theemmeanspackage.- draw_indices
Character vector of column names that should be treated as indices of draws. Operations are done within combinations of these values. The default is
c(".chain", ".iteration", ".draw"), which is the same names used for chain, iteration, and draw indices returned bytidy_draws(). Names indraw_indicesthat are not found in the data are ignored.- ignore_groups
character vector of names of groups to ignore by default in the input grouping. This is primarily provided to make it easier to pipe output of
add_epred_draws()into this function, as that function provides a".row"output column that is grouped, but which is virtually never desired to group by when usingcompare_levels.
Value
A data.frame with the same columns as data, except
that the by column contains a symbolic representation of the
comparison of pairs of levels of by in data, and
variable contains the result of that comparison.
Details
This function simplifies conducting comparisons across levels of some
variable in a tidy data frame of draws. It applies fun to all
values of variable for each pair of levels of by as selected
by comparison. By default, all pairwise comparisons are generated if
by is an unordered factor and ordered comparisons are made if
by is ordered.
The included comparison types are:
ordered: compare each leveliwith leveli - 1; e.g.fun(i, i - 1)pairwise: compare each level ofbywith every other level.control: compare each level ofbywith the first level ofby. If you wish to compare with a different level, you can first applyrelevel()tobyto set the control (reference) level.default: useorderedifis.ordered(by)andpairwiseotherwise.
See also
emmeans_comparison() to use emmeans-style contrast methods with
compare_levels().
Examples
library(dplyr)
library(ggplot2)
data(RankCorr, package = "ggdist")
# Let's do all pairwise comparisons of b[i,1]:
RankCorr %>%
spread_draws(b[i,j]) %>%
filter(j == 1) %>%
compare_levels(b, by = i) %>%
median_qi()
#> # A tibble: 3 × 8
#> i j b .lower .upper .width .point .interval
#> <chr> <int> <dbl> <dbl> <dbl> <dbl> <chr> <chr>
#> 1 2 - 1 1 0.343 -0.00937 0.684 0.95 median qi
#> 2 3 - 1 1 0.734 0.416 1.08 0.95 median qi
#> 3 3 - 2 1 0.402 -0.0133 0.791 0.95 median qi
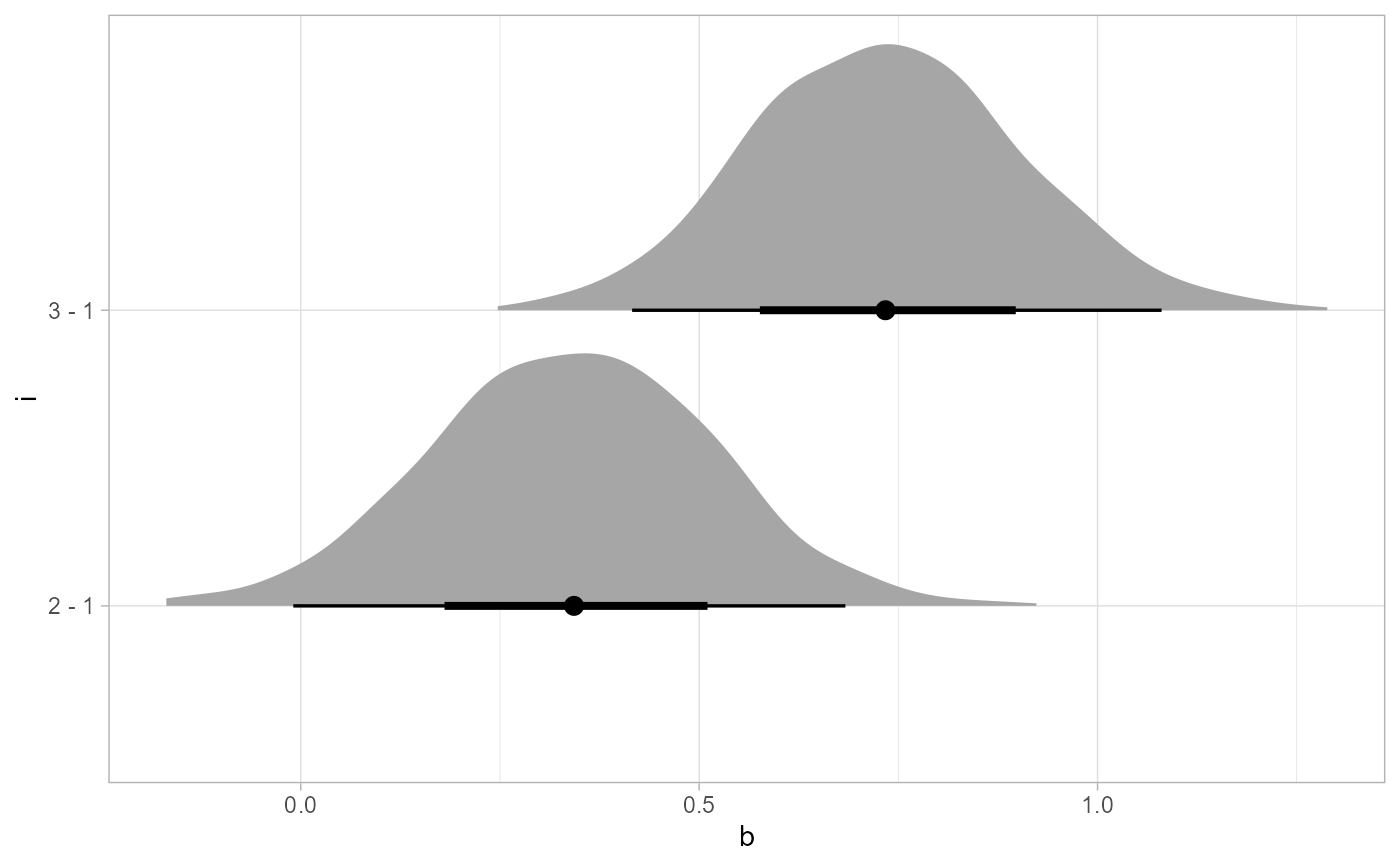
# Or let's plot all comparisons against the first level (control):
RankCorr %>%
spread_draws(b[i,j]) %>%
filter(j == 1) %>%
compare_levels(b, by = i, comparison = control) %>%
ggplot(aes(x = b, y = i)) +
stat_halfeye()
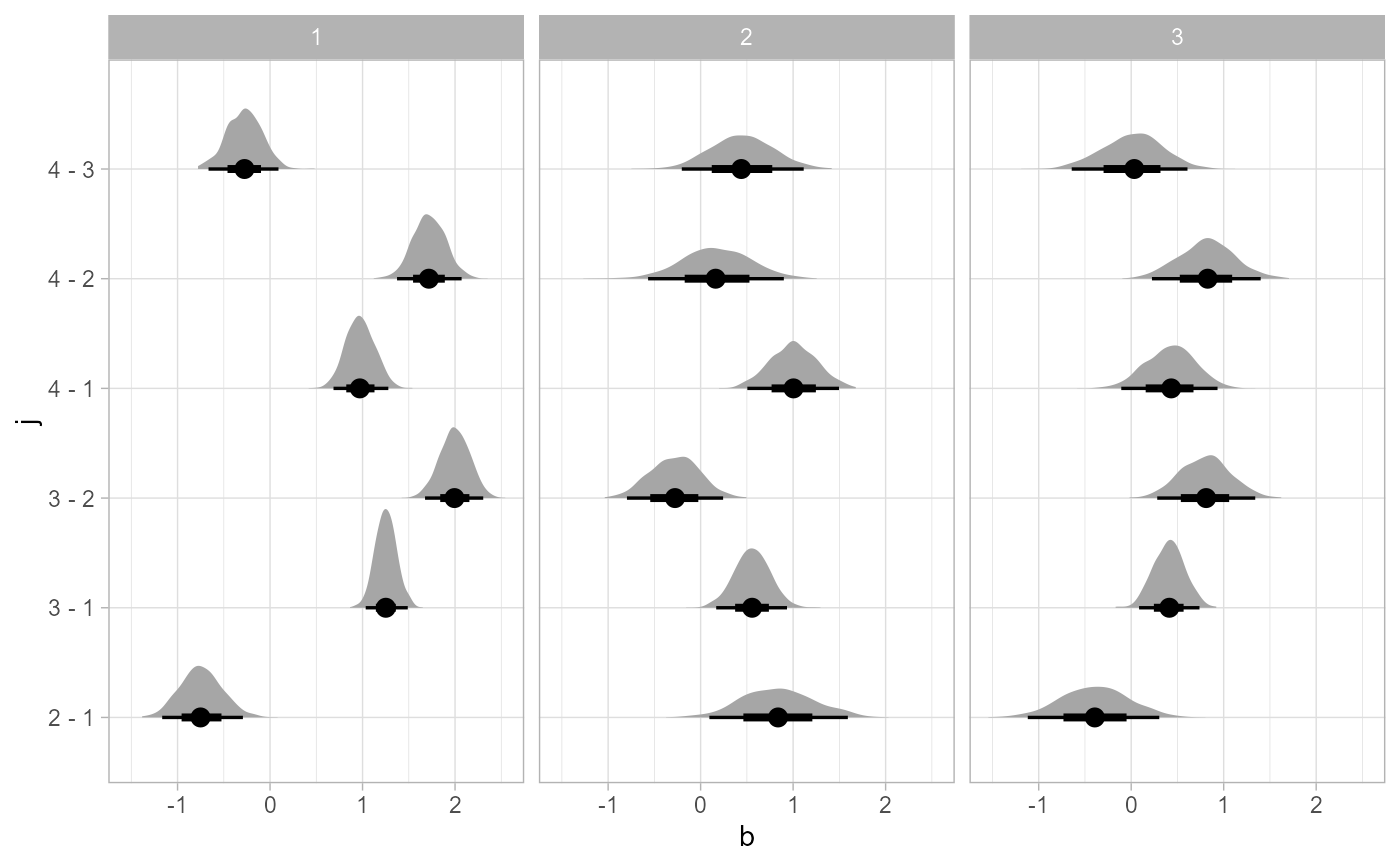
 # Or let's plot comparisons of all levels of j within
# all levels of i
RankCorr %>%
spread_draws(b[i,j]) %>%
group_by(i) %>%
compare_levels(b, by = j) %>%
ggplot(aes(x = b, y = j)) +
stat_halfeye() +
facet_grid(cols = vars(i))
# Or let's plot comparisons of all levels of j within
# all levels of i
RankCorr %>%
spread_draws(b[i,j]) %>%
group_by(i) %>%
compare_levels(b, by = j) %>%
ggplot(aes(x = b, y = j)) +
stat_halfeye() +
facet_grid(cols = vars(i))