Given a tidy-format data frame of draws with a column indexing each draw, subsample the data frame to a given size based on a column indexing draws, ensuring that rows in sub-groups of a grouped data frame are sampled from the same draws.
sample_draws(data, ndraws, draw = ".draw", seed = NULL)Arguments
Details
sample_draws() makes it easier to sub-sample a grouped, tidy-format data frame of draws. On a grouped data frame,
the naive approach of using filter with the .draw column will give incorrect results as it will
select a different sample within each group. sample_draws() ensures the same sample is selected within
each group.
Examples
# \dontrun{
library(ggplot2)
library(dplyr)
library(brms)
library(modelr)
theme_set(theme_light())
m_mpg = brm(mpg ~ hp * cyl, data = mtcars,
# 1 chain / few iterations just so example runs quickly
# do not use in practice
chains = 1, iter = 500)
#> Compiling Stan program...
#> Start sampling
#>
#> SAMPLING FOR MODEL 'anon_model' NOW (CHAIN 1).
#> Chain 1:
#> Chain 1: Gradient evaluation took 4e-05 seconds
#> Chain 1: 1000 transitions using 10 leapfrog steps per transition would take 0.4 seconds.
#> Chain 1: Adjust your expectations accordingly!
#> Chain 1:
#> Chain 1:
#> Chain 1: Iteration: 1 / 500 [ 0%] (Warmup)
#> Chain 1: Iteration: 50 / 500 [ 10%] (Warmup)
#> Chain 1: Iteration: 100 / 500 [ 20%] (Warmup)
#> Chain 1: Iteration: 150 / 500 [ 30%] (Warmup)
#> Chain 1: Iteration: 200 / 500 [ 40%] (Warmup)
#> Chain 1: Iteration: 250 / 500 [ 50%] (Warmup)
#> Chain 1: Iteration: 251 / 500 [ 50%] (Sampling)
#> Chain 1: Iteration: 300 / 500 [ 60%] (Sampling)
#> Chain 1: Iteration: 350 / 500 [ 70%] (Sampling)
#> Chain 1: Iteration: 400 / 500 [ 80%] (Sampling)
#> Chain 1: Iteration: 450 / 500 [ 90%] (Sampling)
#> Chain 1: Iteration: 500 / 500 [100%] (Sampling)
#> Chain 1:
#> Chain 1: Elapsed Time: 0.128 seconds (Warm-up)
#> Chain 1: 0.045 seconds (Sampling)
#> Chain 1: 0.173 seconds (Total)
#> Chain 1:
#> Warning: The largest R-hat is 1.07, indicating chains have not mixed.
#> Running the chains for more iterations may help. See
#> https://mc-stan.org/misc/warnings.html#r-hat
#> Warning: Bulk Effective Samples Size (ESS) is too low, indicating posterior means and medians may be unreliable.
#> Running the chains for more iterations may help. See
#> https://mc-stan.org/misc/warnings.html#bulk-ess
#> Warning: Tail Effective Samples Size (ESS) is too low, indicating posterior variances and tail quantiles may be unreliable.
#> Running the chains for more iterations may help. See
#> https://mc-stan.org/misc/warnings.html#tail-ess
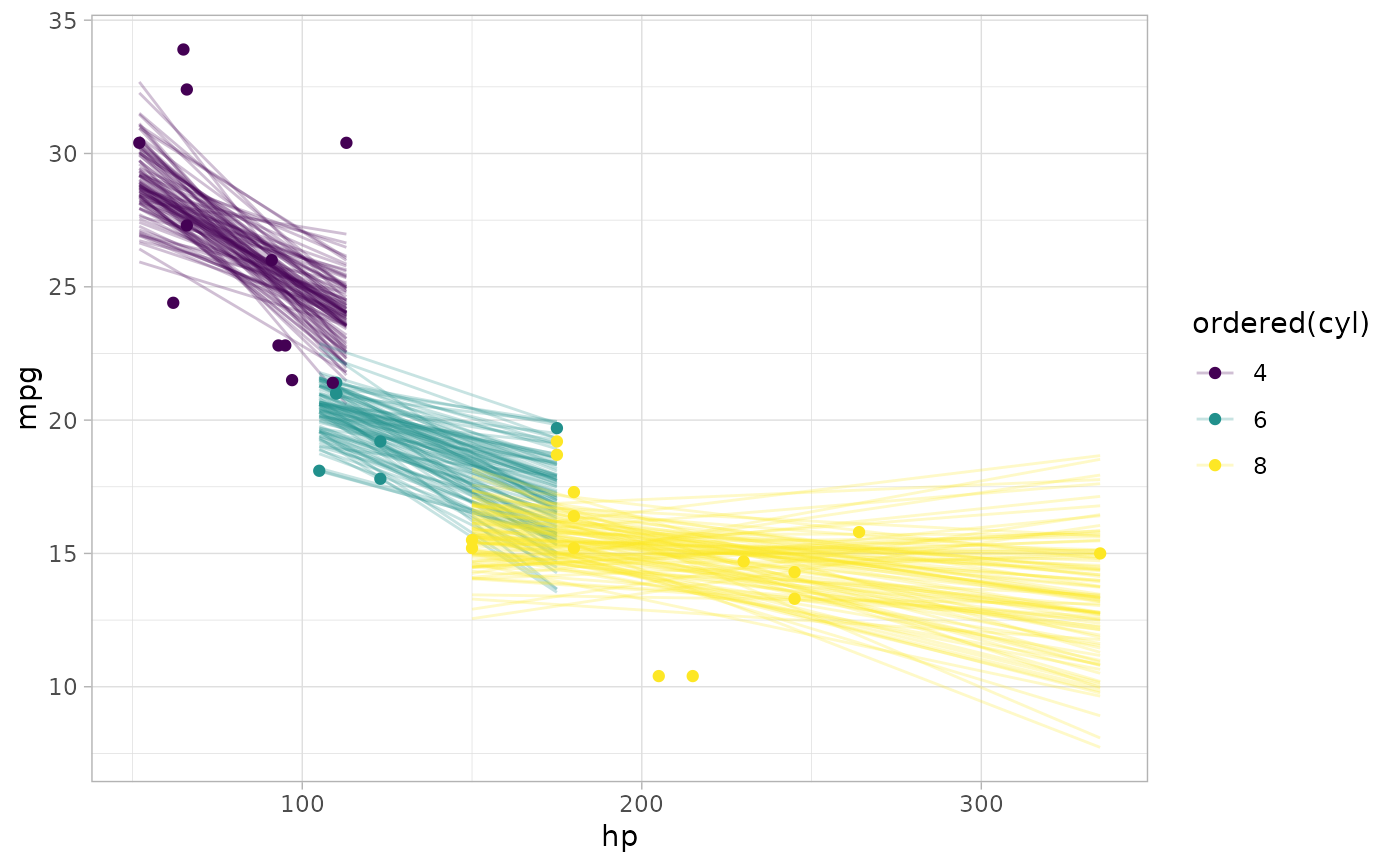
# draw 100 fit lines from the posterior and overplot them
mtcars %>%
group_by(cyl) %>%
data_grid(hp = seq_range(hp, n = 101)) %>%
add_epred_draws(m_mpg) %>%
# NOTE: only use sample_draws here when making spaghetti plots; for
# plotting intervals it is always best to use all draws
sample_draws(100) %>%
ggplot(aes(x = hp, y = mpg, color = ordered(cyl))) +
geom_line(aes(y = .epred, group = paste(cyl, .draw)), alpha = 0.25) +
geom_point(data = mtcars)
 # }
# }