Pipable ggplot2 layer data
plot_data.RdA wrapper around data to be passed to the data argument of ggplot2::layer().
Pipe it into a ggbuilder layer to set the data used by that layer.
Arguments
- data
One of:
NULL: Use the data from theggplot2()object.A function: apply this function to the data from the
ggplot2()object when constructing the data for the layer.A
data.frame(): use this data frame as the data for the layer.
Value
A ggbuilder plot_data, which can be piped into other ggbuilder functions. Can also be piped into dplyr and tidyr verbs in order to construct a new plot_data that will apply those verbs to the data.
Examples
library(ggplot2)
set.seed(123456)
df = data.frame(condition = c("A", "B", "C"), response = round(rnorm(30, 1:3), 1))
df |>
ggplot(aes(x = condition, y = response, color = condition)) +
geom_boxplot() +
plot_data(\(x) x[x$condition %in% c("B", "C"),]) |>
stat_("boxplot", aes(y = response)) |>
geom_("label", aes(y = ymax, label = ymax))
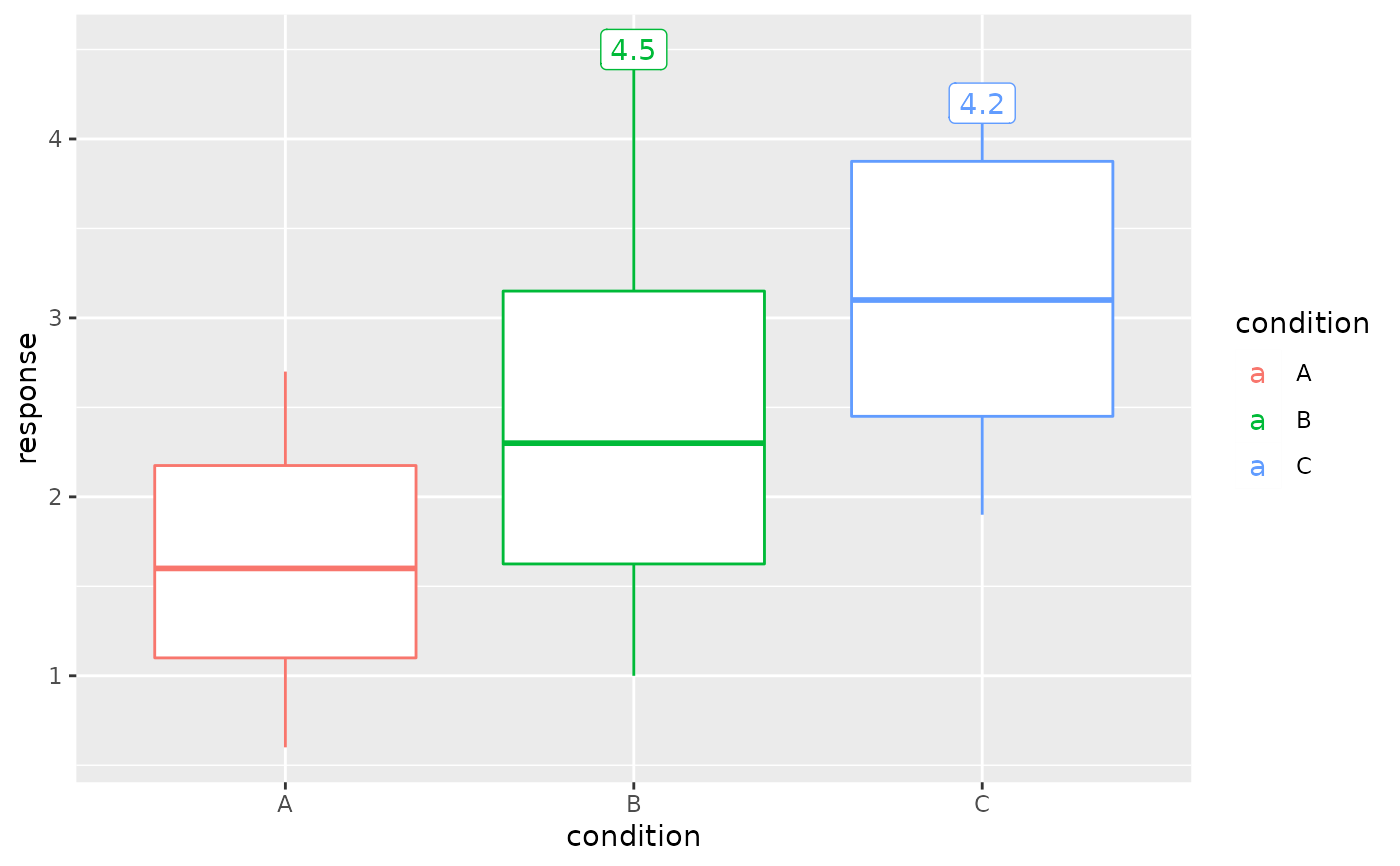 df |>
ggplot(aes(x = condition, y = response, color = condition)) +
geom_boxplot() +
plot_data() |>
dplyr::filter(condition %in% c("B", "C")) |>
dplyr::group_by(condition) |>
dplyr::slice_max(response) |>
geom_("label", aes(label = response))
df |>
ggplot(aes(x = condition, y = response, color = condition)) +
geom_boxplot() +
plot_data() |>
dplyr::filter(condition %in% c("B", "C")) |>
dplyr::group_by(condition) |>
dplyr::slice_max(response) |>
geom_("label", aes(label = response))
