Secondary color scale that ramps from another color (ggplot2 scale)
Source:R/scale_colour_ramp.R
scale_colour_ramp.RdThis scale creates a secondary scale that modifies the fill or color scale of
geoms that support it (geom_lineribbon() and geom_slabinterval()) to "ramp"
from a secondary color (by default white) to the primary fill color (determined
by the standard color or fill aesthetics). It uses the
partial_colour_ramp() data type.
Usage
scale_colour_ramp_continuous(
  from = "white",
  ...,
  limits = function(l) c(min(0, l[[1]]), l[[2]]),
  range = c(0, 1),
  guide = "legend",
  aesthetics = "colour_ramp"
)

scale_color_ramp_continuous(
  from = "white",
  ...,
  limits = function(l) c(min(0, l[[1]]), l[[2]]),
  range = c(0, 1),
  guide = "legend",
  aesthetics = "colour_ramp"
)

scale_colour_ramp_discrete(
  from = "white",
  ...,
  range = c(0.2, 1),
  aesthetics = "colour_ramp"
)

scale_color_ramp_discrete(
  from = "white",
  ...,
  range = c(0.2, 1),
  aesthetics = "colour_ramp"
)

scale_fill_ramp_continuous(..., aesthetics = "fill_ramp")

scale_fill_ramp_discrete(..., aesthetics = "fill_ramp")
Arguments
- from
<string> The color to ramp from. Corresponds to
0on the scale.- ...
Arguments passed to underlying scale or guide functions. E.g.
scale_colour_ramp_discrete()passes arguments todiscrete_scale(),scale_colour_ramp_continuous()passes arguments tocontinuous_scale(). See those functions for more details.- limits
One of:
NULLto use the default scale rangeA numeric vector of length two providing limits of the scale. Use
NAto refer to the existing minimum or maximumA function that accepts the existing (automatic) limits and returns new limits. Also accepts rlang lambda function notation. Note that setting limits on positional scales will remove data outside of the limits. If the purpose is to zoom, use the limit argument in the coordinate system (see
coord_cartesian()).
- range
<length-2 numeric> Minimum and maximum values after the scale transformation. These values should be between
0(thefromcolor) and1(the color determined by thefillaesthetic).- guide
<Guide | string> A function used to create a guide or its name. For
scale_colour_ramp_continuous()andscale_fill_ramp_continuous(),guide_rampbar()can be used to create gradient color bars. Seeguides()for information on other guides.- aesthetics
<character> Names of aesthetics to set scales for.
Value
A ggplot2::Scale representing a scale for the colour_ramp and/or fill_ramp
aesthetics for ggdist geoms. Can be added to a ggplot() object.
Details
These scales transform data into partial_colour_ramps. Each partial_colour_ramp
is a pair of two values: a from colour and a numeric amount between 0
and 1 representing a distance between from and the target color (where 0
indicates the from color and 1 the target color).
The target color is determined by the corresponding aesthetic: for example,
the colour_ramp aesthetic creates ramps between from and whatever the
value of the colour aesthetic is; the fill_ramp aesthetic creates ramps
between from and whatever the value of the fill aesthetic is. When the
colour_ramp aesthetic is set, ggdist geometries will modify their
colour by applying the colour ramp between from and colour (and
similarly for fill_ramp and fill).
Colour ramps can be applied (i.e. translated into colours) using
ramp_colours(), which can be used with partial_colour_ramp()
to implement geoms that make use of colour_ramp or fill_ramp scales.
See also
Other ggdist scales:
scale_side_mirrored(),
scale_thickness,
sub-geometry-scales
Other colour ramp functions:
guide_rampbar(),
partial_colour_ramp(),
ramp_colours()
Examples
library(dplyr)
library(ggplot2)
library(distributional)
tibble(d = dist_uniform(0, 1)) %>%
ggplot(aes(y = 0, xdist = d)) +
stat_slab(aes(fill_ramp = after_stat(x)))
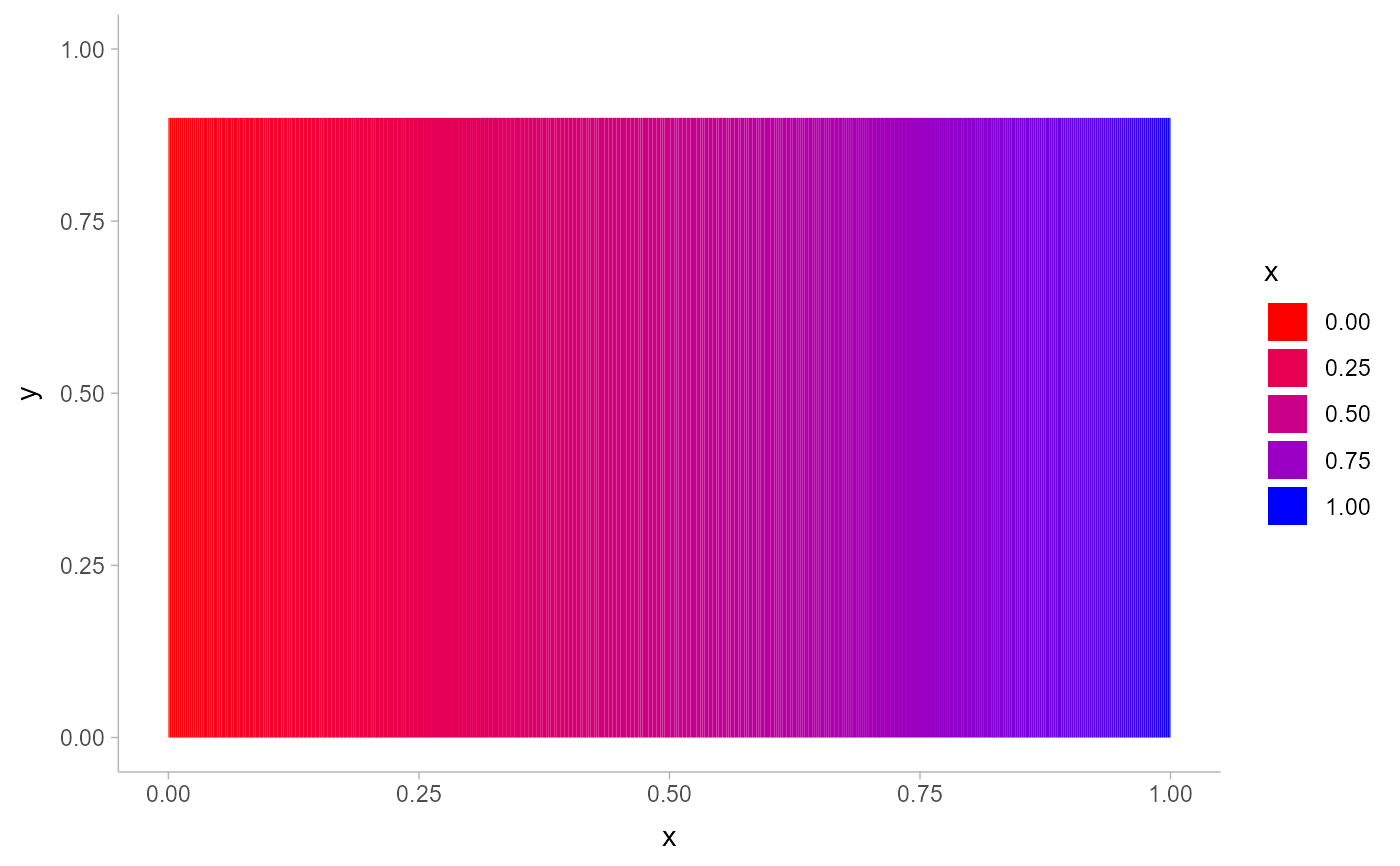
 tibble(d = dist_uniform(0, 1)) %>%
ggplot(aes(y = 0, xdist = d)) +
stat_slab(aes(fill_ramp = after_stat(x)), fill = "blue") +
scale_fill_ramp_continuous(from = "red")
tibble(d = dist_uniform(0, 1)) %>%
ggplot(aes(y = 0, xdist = d)) +
stat_slab(aes(fill_ramp = after_stat(x)), fill = "blue") +
scale_fill_ramp_continuous(from = "red")
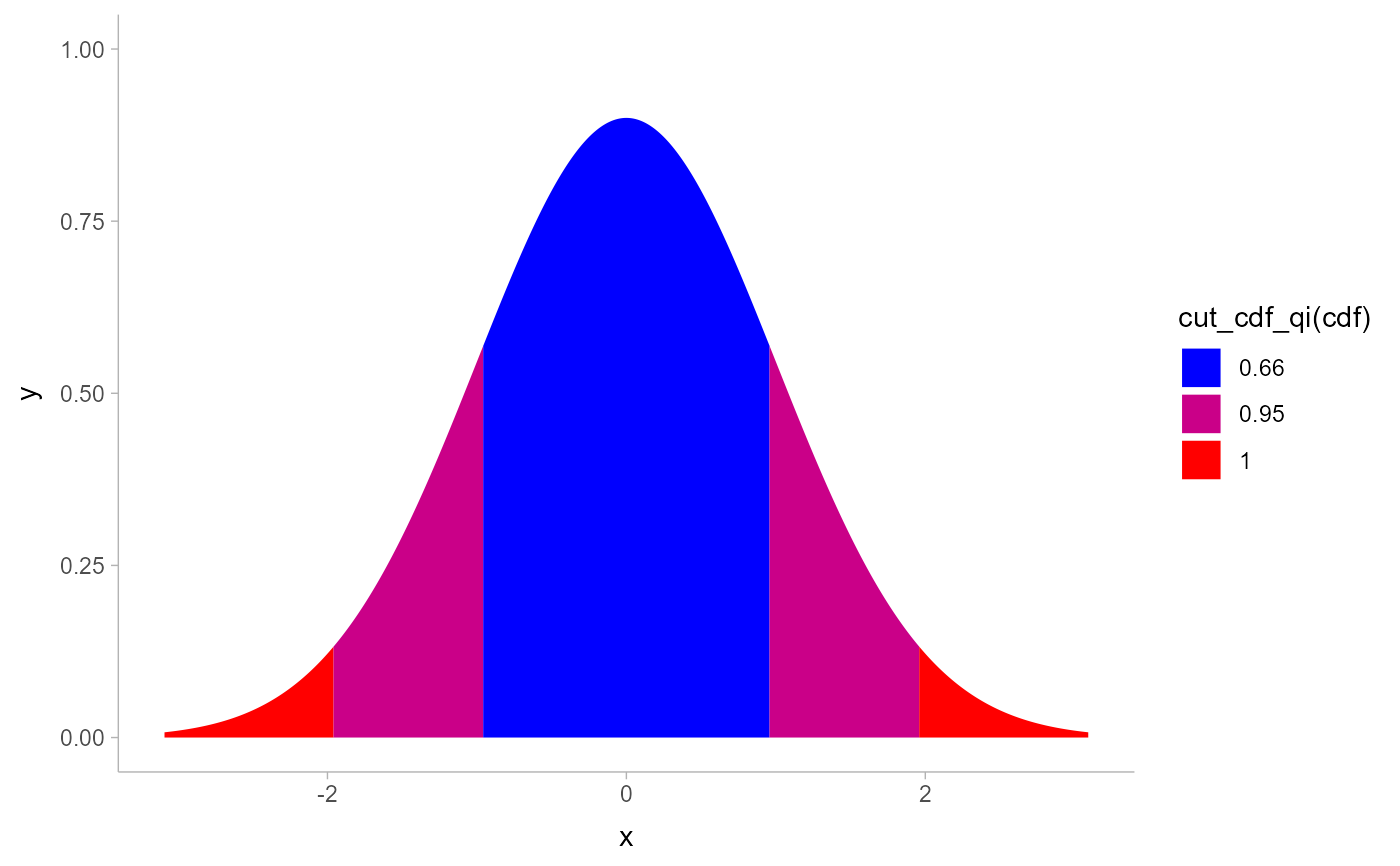
 # you can invert the order of `range` to change the order of the blend
tibble(d = dist_normal(0, 1)) %>%
ggplot(aes(y = 0, xdist = d)) +
stat_slab(aes(fill_ramp = after_stat(cut_cdf_qi(cdf))), fill = "blue") +
scale_fill_ramp_discrete(from = "red", range = c(1, 0))
# you can invert the order of `range` to change the order of the blend
tibble(d = dist_normal(0, 1)) %>%
ggplot(aes(y = 0, xdist = d)) +
stat_slab(aes(fill_ramp = after_stat(cut_cdf_qi(cdf))), fill = "blue") +
scale_fill_ramp_discrete(from = "red", range = c(1, 0))